
Reading charts, finding insights
Data analysis with no code: read an unfamiliar chart, know which question it answers, spot the ways of drawing that mislead and the data that isn't there, then say an honest insight. Over a hundred charts of real data from around the world, with true stories.
- Beginner
- About 4 hours
- 13 sections
- 42 lessons
The course opens in batches, each with a limited number of free seats. You take your seat in the Academy, signing in with Google or GitHub.
Included in the membership · See plans
Course outline
Section 1
What question does this chart answer?
About this course
Lesson · 4 min
Five questions before you read
Lesson · 10 min
Six cities, six kinds of weather
Lesson · 14 min
Section 2
Three levels of reading
One chart, three questions
Lesson · 12 min
Reading beyond, and saying it's a guess
Lesson · 12 min
Longer lives, fewer children lost
Lesson · 16 min
Section 3
The right shape for the question
Parts and the whole
Lesson · 14 min
Over time, or one moment
Lesson · 10 min
Two numbers, then many dots
Lesson · 10 min
Section 4
One dot, one person
From dots to a shape
Lesson · 10 min
Average, median and a very rich person
Lesson · 18 min
Always look at the picture
Lesson · 14 min
Section 5
Over time
Four things in one line
Lesson · 12 min
Choosing the window
Lesson · 14 min
When things multiply
Lesson · 14 min
Section 6
Fair comparisons
Total, or per person?
Lesson · 16 min
Percentages and risks
Lesson · 12 min
Money now and money then
Lesson · 6 min
Section 7
Rising together isn't cause
Ice cream and drowning
Lesson · 13 min
Reverse cause and coincidence
Lesson · 15 min
Observation or experiment
Lesson · 12 min
Section 8
The hidden groups
One number, two stories
Lesson · 14 min
The kidney stones
Lesson · 12 min
Find the hidden group yourself
Lesson · 10 min
Section 9
The data that isn't there
The planes that came back
Lesson · 10 min
Who was asked?
Lesson · 12 min
The flights with no damage
Lesson · 12 min
The rows that didn't fit
Lesson · 14 min
Section 10
Small groups, big extremes
Small schools top the list
Lesson · 12 min
Luck in small groups
Lesson · 8 min
Back toward the average
Lesson · 12 min
An odd point is a question
Lesson · 6 min
Section 11
Charts that mislead
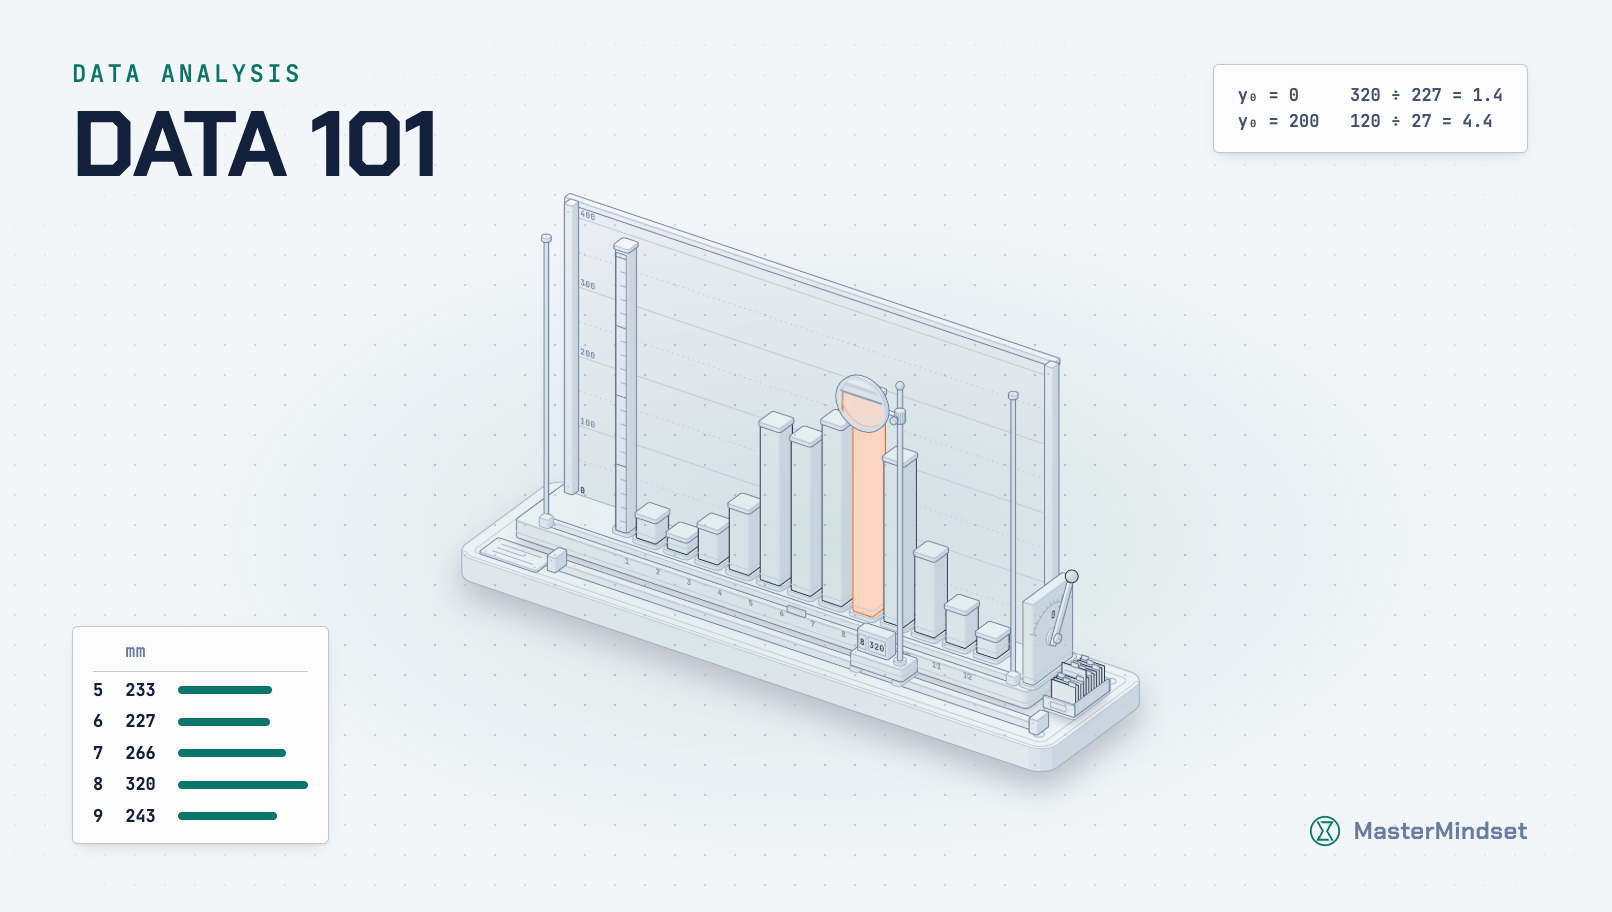
A ruler that was adjusted
Lesson · 10 min
Choosing the stretch, choosing the order
Lesson · 10 min
What to count, what to divide by, which shape
Lesson · 12 min
The chart doctor
Lesson · 8 min
Section 12
From chart to insight
An insight is one sentence
Lesson · 8 min
Charts that changed things: Snow and Nightingale
Lesson · 18 min
Rosling: the countries on one chart
Lesson · 10 min
Capstone: fifty years, five places
Lesson · 22 min
Section 13
Final exam
Final exam
Quiz · 30 min
After the exam
Lesson · 5 min